
2Department of Cardiology, The Third People’s Hospital of Bengbu, Bengbu City, China
Abstract
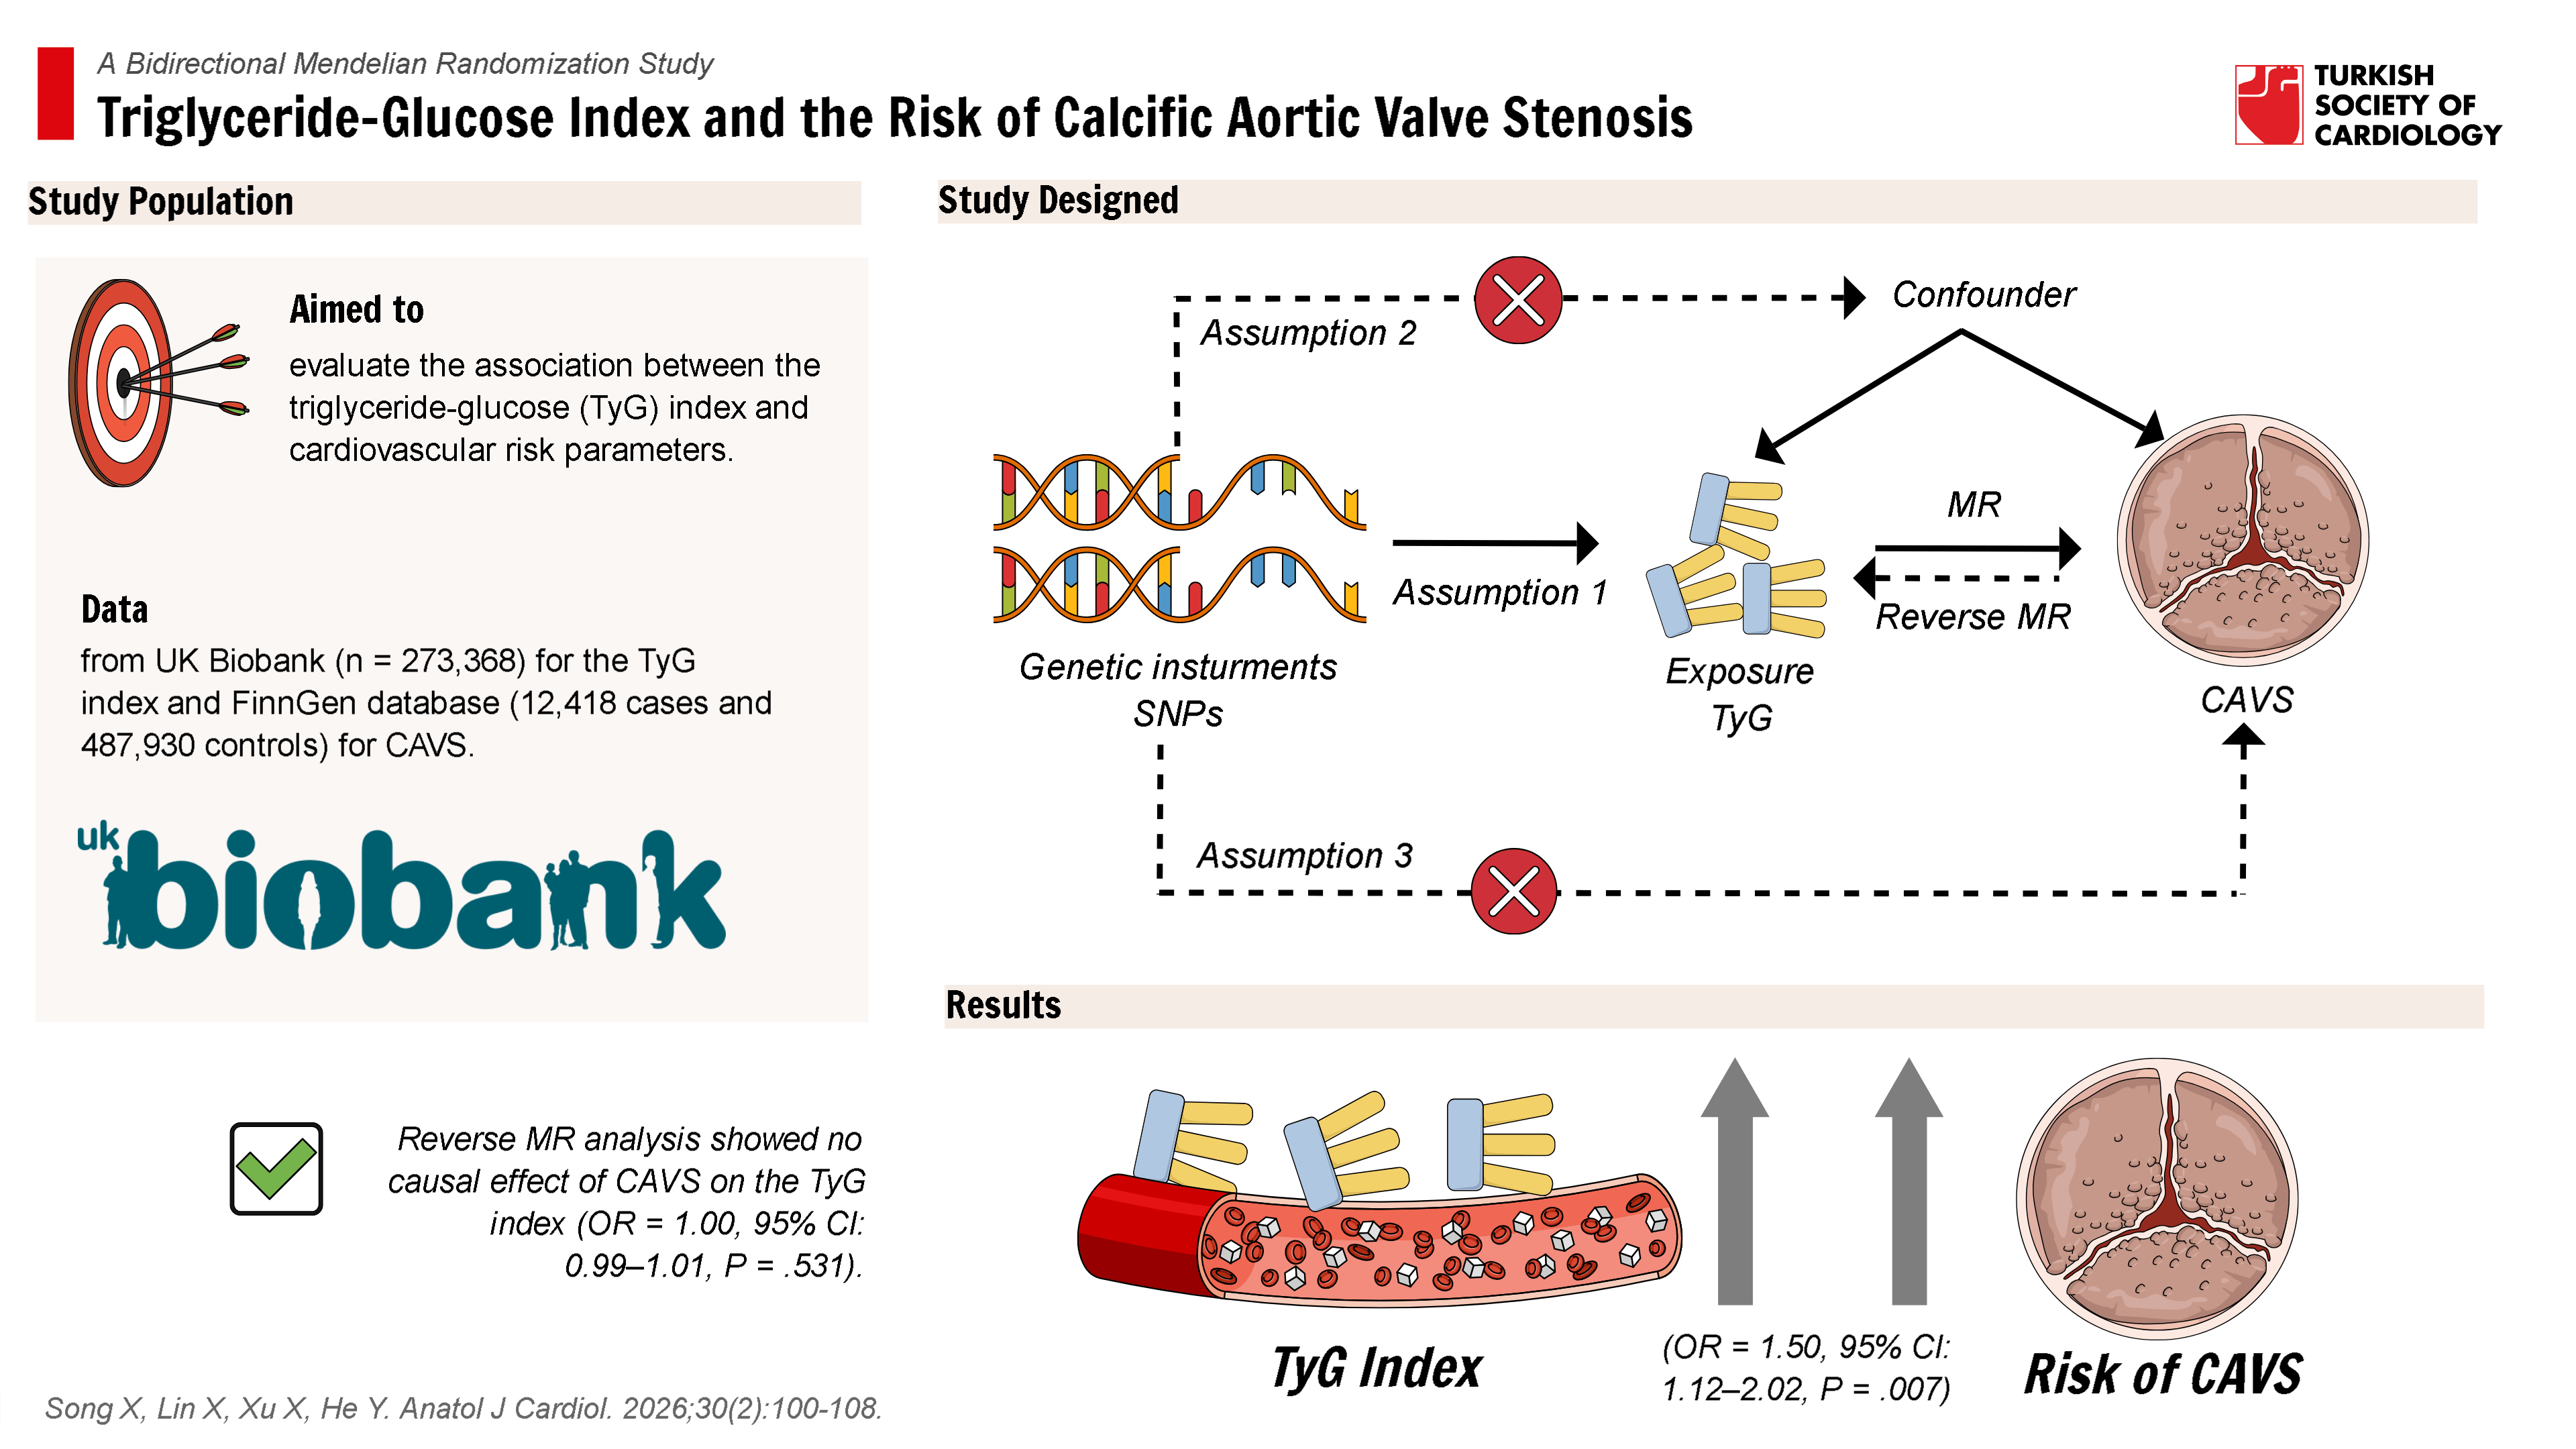
Background: Calcific aortic valve stenosis (CAVS), the predominant valvular heart disease in developed countries, arises primarily from metabolic and inflammatory dysregulation. The triglyceride-glucose (TyG) index, a composite biomarker of insulin resistance and systemic inflammation, has been associated with cardiovascular diseases. However, its causal association with CAVS remains unclear. This study employs bidirectional Mendelian randomization (MR) to elucidate the potential causal relationship between the TyG index and CAVS.
Methods: Genome-wide association study) summary statistics of TyG index and CAVS were obtained from UK-biobank cohort (n = 273 368) and FinnGen database (cases = 12 418 and controls = 487 930). Two-sample MR and multiple MR analyses were conducted to evaluate the association of TyG index with CAVS. The primary method was inverse variance weighted (IVW), complemented by MR-Egger, weighted median, and sensitivity analyses to ensure robustness.
Results: The MR analysis demonstrated a significant causal effect of the higher TyG index (per 1-unit increment of TyG index) on CAVS risk (odds ratio [OR] = 1.50, P = .007, 95% CI: 1.12-2.02). Similar causal relationships were observed for triglyceride and glucose levels with CAVS. Sensitivity analyses confirmed robustness with no evidence of horizontal pleiotropy (P > .05). This association remained statistically significant in multiple MR analyses after adjusting for potential confounders (OR = 1.64, P = .003, 95% CI: 1.18-2.28). No reverse causality from CAVS to the TyG index was detected.
Conclusion: This MR study provides evidence supporting the causal effect of higher TyG index on CAVS.
Graphical Abstract
Highlights
- This study reveals a unidirectional causal relationship between elevated triglyceride-glucose (TyG) index and higher calcific aortic valve stenosis (CAVS) risk, employing bidirectional Mendelian randomization analysis.
- This study supports the involvement of insulin resistance and systemic inflammation in CAVS development.
- This study proposes the TyG index as a metabolic biomarker to stratify CAVS risk and guide prevention.
Introduction
Calcific aortic valve stenosis (CAVS) is the most prevalent valvular heart disease in developed countries, with an incidence of 2%-3% in individuals aged >65 years.1-
The triglyceride-glucose (TyG) index, a novel and cost-effective marker of insulin resistance derived from fasting triglyceride and glucose levels, has gained attention for its clinical utility.15-
However, the causal relationship between the TyG index and CAVS remains unclear, necessitating robust analytical approaches such as Mendelian randomization (MR) to address potential confounding and reverse causality.31,
Methods
Study Design
This study utilized a bidirectional MR framework to assess causal relationships in both directions: (1) the effect of the TyG index on the risk of CAVS and (2) the effect of CAVS on the TyG index. The MR analysis is grounded in 3 fundamental assumptions: (1) the selected instrumental variables (IVs) must exhibit strong associations with the TyG index, triglyceride levels, and glucose levels; (2) the IVs must be independent of potential confounders; and (3) the IVs should influence CAVS exclusively through the TyG index, triglycerides, and glucose levels, but not other pathways. A schematic overview of the study design is presented in
Two Sample Mendelian Randomization Analysis
The 2-sample MR was adopted to investigate the causal association between TyG index and CAVS. Summary statistics were obtained from publicly available genome-wide association study (GWAS) databases, including the Integrative Epidemiology Unit Open GWAS Project (IEU-GWAS), the United Kingdom Biobank (UK Biobank), and the Finnish Genetics (FinnGen) database. In this study, single nucleotide polymorphisms (SNPs) strongly associated with the TyG index, triglyceride, and glucose levels were selected as IVs. These SNPs are randomly allocated at the time of conception, ensuring the minimal influence of environmental factors.36 Initially, the random-effects inverse variance weighted (IVW) method was applied to estimate the causal effect of TyG index on CAVS. To enhance the robustness of the outcomes, complementary approaches such as the MR Egger, weighted median, simple mode, and weighted mode methods were applied. Furthermore, heterogeneity and pleiotropy were assessed using the IVW method and MR-Egger intercept, while leave-one-out analysis was performed to evaluate the influence of individual variants. All study procedures adhered to the STROBE-MR guidelines.37,
Multiple Mendelian Randomization Analysis
To further address potential pleiotropy arising from confounding factors, multiple MR analyses were conducted, adjusting for body mass index (BMI), low-density lipoprotein cholesterol (LDL-C), diabetes mellitus (DM), and hypertension (HTN). First, the causal effects of TyG index, triglyceride, and glucose levels on CAVS were evaluated through multiple MR analyses. Subsequently, the IVW method and the MR-Egger intercept were utilized to evaluate heterogeneity and pleiotropy. All results were visualized in forest plots for clarity and comparison.
Date Sources and Single Nucleotide Polymorphisms Selection
Genetic variants associated with the TyG index were derived from a prior GWAS based on the UK Biobank cohort,39 which included 273 368 individuals aged 40-69 years without diabetes or lipid metabolism disorders. The SNPs associated with the TyG index at genome-wide significance (
To ensure effectiveness of the SNPs and avoid bias, linkage disequilibrium was defined with
Genetic variants for triglycerides and glucose were sourced from IEU-GWAS (
Details on all datasets downloaded and screened are displayed in
Statistical Analysis
All statistics were calculated using R software version 4.4.2 (The R Foundation for Statistical Computing, Vienna, Austria). The causal effect was deemed significant if the IVW
Results
Two-Sample Mendelian Randomization Analysis
The 2-sample MR analysis based on the IVW method demonstrated a significant causal association between genetically predicted TyG index (n = 273 368 individuals) and CAVS (OR = 1.50,
The IVW method was used to test for heterogeneity, and the MR-Egger intercept to test pleiotropy. Although significant heterogeneity was observed (
Multiple Mendelian Randomization Analysis
Univariable MR analysis supported a causal role of the TyG index in CAVS development (OR = 1.77,
Reverse 2-Sample Mendelian Randomization Analysis
The reverse 2 sample MR analysis based on the IVW method revealed no significant association between genetically predicted CAVS (n = 500 348 individuals) and triglycerides (OR = 1.01,
No significant evidence of directional pleiotropy was detected in the association between CAVS and triglycerides (
Discussion
To the best of knowledge, this is the first bidirectional MR study to comprehensively assess the causal relationship between the TyG index and CAVS. Conversely, no substantial causal effect of CAVS on the TyG index was observed. These results highlight that insulin resistance, as reflected by the TyG index, contributes to CAVS pathophysiology independently of established clinical and metabolic confounders.
Previous observational studies have suggested that the TyG index, a surrogate marker of insulin resistance, may contribute to CAVS through its pro-oxidant and pro-inflammatory properties. However, the evidence remains inconsistent and limited. For instance, a case-control study involving 361 patients with aortic valve calcification and 89 controls reported a significant predictive value of the TyG index for aortic valve calcification (OR = 1.743,
In this 2-sample MR study, genetic variants were utilized as IVs to establish a robust causal association between elevated TyG index (n = 273 368 individuals) and increased CAVS risk (OR = 1.50,
Several plausible mechanisms may explain the observed positive correlation between elevated TyG index and CAVS. First, systemic inflammation plays a pivotal role. Insulin resistance, as indicated by a higher TyG index, promotes systemic inflammation through the activation of pro-inflammatory pathways, such as nuclear factor-kappaB and the NLRP3 inflammasome.47,
The TyG index may serve as an accessible and cost-effective biomarker for identifying individuals at high risk for CAVS. Early identification of at-risk populations could facilitate targeted preventive strategies. Further research is necessary to demonstrate the precise mechanistic pathways through which insulin resistance promotes valvular calcification, particularly the roles of inflammation, oxidative stress, and lipid metabolism.
Strengths and Limitations
This study is the first to investigate the causal relationship between the TyG index and CAVS, filling a significant gap in the literature. The bidirectional MR design provides a robust framework for assessing causality in both directions, effectively mitigating potential reverse causation. The use of genetic variants as IVs minimizes confounding and enhances causal inference. Nevertheless, several limitations should be acknowledged. First, the study population was exclusively of European ancestry, which may limit the generalizability of the findings to other ethnic groups. Genetic determinants of the TyG index and their impact on CAVS risk may vary across populations, underscoring the need for replication in more diverse cohorts. Second, while the MR approach reduces confounding, it relies on the assumption that the genetic instruments are valid, which may not hold in all cases. Although sensitivity analyses, including MR-Egger and IVW methods, were employed to address pleiotropy, residual pleiotropic effects cannot be entirely ruled out. Third, the limited GWAS data for the TyG index restricted its direct application in reverse MR analysis. Future studies with larger, more diverse populations are warranted to validate these findings.
Conclusion
In conclusion, the MR study demonstrates a causal association between higher TyG index and increased risk of CAVS, highlighting the important role of metabolic regulation in CAVS pathogenesis and prevention.
Supplementary Materials
Footnotes
References
- Carabello BA, Paulus WJ. Aortic stenosis. Lancet. 2009;373(9667):956-966. https://doi.org/10.1016/S0140-6736(09)60211-7
- Coffey S, Cairns BJ, Iung B. The modern epidemiology of heart valve disease. Heart. 2016;102(1):75-85. https://doi.org/10.1136/heartjnl-2014-307020
- Iung B, Vahanian A. Epidemiology of valvular heart disease in the adult. Nat Rev Cardiol. 2011;8(3):162-172. https://doi.org/10.1038/nrcardio.2010.202
- Goody PR, Hosen MR, Christmann D. Aortic valve stenosis: from basic mechanisms to novel therapeutic targets. Arterioscler Thromb Vasc Biol. 2020;40(4):885-900. https://doi.org/10.1161/ATVBAHA.119.313067
- Otto CM, Prendergast B. Aortic-valve stenosis—from patients at risk to severe valve obstruction. N Engl J Med. 2014;371(8):744-756. https://doi.org/10.1056/NEJMra1313875
- Baumgartner H, Falk V, Bax JJ. ESC/EACTS Guidelines for the management of valvular heart disease. Pol Heart J (Kardiol Pol). 2018;76(1):1-62.
- Rajamannan NM, Evans FJ, Aikawa E. Calcific aortic valve disease: not simply a degenerative process a review and agenda for research from the National Heart and Lung and Blood Institute Aortic Stenosis Working Group. Circulation. 2011;124(16):-1783. https://doi.org/10.1161/CIRCULATIONAHA.110.006767
- Pawade TA, Newby DE, Dweck MR. Calcification in aortic stenosis: the skeleton key. J Am Coll Cardiol. 2015;66(5):561-577. https://doi.org/10.1016/j.jacc.2015.05.066
- Capoulade R, Clavel M-A, Dumesnil JG. Insulin resistance and LVH progression in patients with calcific aortic stenosis: a substudy of the ASTRONOMER trial. JACC Cardiovasc Imaging. 2013;6(2):165-174. https://doi.org/10.1016/j.jcmg.2012.11.004
- Sohlman M, Jauhiainen R, Vangipurapu J. Biomarkers reflecting insulin resistance increase the risk of aortic stenosis in a population-based study of 10,144 Finnish men. Ann Med. 2024;56(1):2419996-. https://doi.org/10.1080/07853890.2024.2419996
- Dweck MR, Boon NA, Newby DE. Calcific aortic stenosis: a disease of the valve and the myocardium. J Am Coll Cardiol. 2012;60(19):1854-1863. https://doi.org/10.1016/j.jacc.2012.02.093
- Lindman BR, Clavel MA, Mathieu P. Calcific aortic stenosis. Nat Rev Dis Primers. 2016;2(1):16006-. https://doi.org/10.1038/nrdp.2016.6
- Moncla LM, Briend M, Bossé Y, Mathieu P. Calcific aortic valve disease: mechanisms, prevention and treatment. Nat Rev Cardiol. 2023;20(8):546-559. https://doi.org/10.1038/s41569-023-00845-7
- Kraler S, Blaser MC, Aikawa E, Camici GG, Lüscher TF. Calcific aortic valve disease: from molecular and cellular mechanisms to medical therapy. Eur Heart J. 2022;43(7):683-697. https://doi.org/10.1093/eurheartj/ehab757
- Lopez-Jaramillo P, Gomez-Arbelaez D, Martinez-Bello D. Association of the triglyceride glucose index as a measure of insulin resistance with mortality and cardiovascular disease in populations from five continents (PURE study): a prospective cohort study. Lancet Healthy Longev. 2023;4(1):e23-e33. https://doi.org/10.1016/S2666-7568(22)00247-1
- Simental-Mendía LE, Rodríguez-Morán M, Guerrero-Romero F. The product of fasting glucose and triglycerides as surrogate for identifying insulin resistance in apparently healthy subjects. Metab Syndr Relat Disord. 2008;6(4):299-304. https://doi.org/10.1089/met.2008.0034
- Abbasi F, Reaven GM. Comparison of two methods using plasma triglyceride concentration as a surrogate estimate of insulin action in nondiabetic subjects: triglycerides× glucose versus triglyceride/high-density lipoprotein cholesterol. Metabolism. 2011;60(12):1673-1676. https://doi.org/10.1016/j.metabol.2011.04.006
- Salvatori B, Linder T, Eppel D. TyGIS: improved triglyceride-glucose index for the assessment of insulin sensitivity during pregnancy. Cardiovasc Diabetol. 2022;21(1):215-. https://doi.org/10.1186/s12933-022-01649-8
- Brito ADM, Hermsdorff HHM, Filgueiras MDS. Predictive capacity of triglyceride-glucose (TyG) index for insulin resistance and cardiometabolic risk in children and adolescents: a systematic review. Crit Rev Food Sci Nutr. 2021;61(16):2783-2792. https://doi.org/10.1080/10408398.2020.1788501
- Ramdas Nayak VK, Satheesh P, Shenoy MT, Kalra S. Triglyceride Glucose (TyG) Index: A surrogate biomarker of insulin resistance. JPMA J Pak Med Assoc. 2022;72(5):986-988. https://doi.org/10.47391/JPMA.22-63
- Tahapary DL, Pratisthita LB, Fitri NA. Challenges in the diagnosis of insulin resistance: focusing on the role of HOMA-IR and Tryglyceride/glucose index. Diabetes Metab Syndr. 2022;16(8):102581-. https://doi.org/10.1016/j.dsx.2022.102581
- Son DH, Lee HS, Lee YJ, Lee JH, Han JH. Comparison of triglyceride-glucose index and HOMA-IR for predicting prevalence and incidence of metabolic syndrome. Nutr Metab Cardiovasc Dis. 2022;32(3):596-604. https://doi.org/10.1016/j.numecd.2021.11.017
- Dundar C, Terzi O, Arslan HN. Comparison of the ability of HOMA-IR, VAI, and TyG indexes to predict metabolic syndrome in children with obesity: a cross-sectional study. BMC Pediatr. 2023;23(1):74-. https://doi.org/10.1186/s12887-023-03892-8
- Vasques ACJ, Novaes FS, de Oliveira MdS. TyG index performs better than HOMA in a Brazilian population: a hyperglycemic clamp validated study. Diabetes Res Clin Pract. 2011;93(3):e98-e100. https://doi.org/10.1016/j.diabres.2011.05.030
- Cesena FY, Generoso G, Santos RD. The association between triglyceride-rich lipoproteins, circulating leukocytes, and low-grade inflammation: the Brazilian Longitudinal Study of Adult Health (ELSA-Brasil). J Clin Lipidol. 2023;17(2):261-271. https://doi.org/10.1016/j.jacl.2023.01.007
- Kawamoto R, Tabara Y, Kohara K. Association between fasting plasma glucose and high-sensitivity C-reactive protein: gender differences in a Japanese community-dwelling population. Cardiovasc Diabetol. 2011;10():51-. https://doi.org/10.1186/1475-2840-10-51
- Liu F, Ling Q, Xie S. Association between triglyceride glucose index and arterial stiffness and coronary artery calcification: a systematic review and exposure-effect meta-analysis. Cardiovasc Diabetol. 2023;22(1):111-. https://doi.org/10.1186/s12933-023-01819-2
- Wang P, Zeng Y, Wang L. Association of TyG index with aortic valve calcification in valvular heart disease patients. Postgrad Med J. 2024;100(1190):917-924. https://doi.org/10.1093/postmj/qgae085
- Li W, Li H, Peng S. Prognostic effect of the TyG index on patients with severe aortic stenosis following transcatheter aortic valve replacement: a retrospective cohort study. Cardiovasc Diabetol. 2024;23(1):312-. https://doi.org/10.1186/s12933-024-02414-9
- Huang R, Xu X, Xu C. Association between the insulin resistance and all-cause mortality in patients with moderate and severe aortic stenosis: a retrospective cohort study. Cardiovasc Diabetol. 2023;22(1):238-. https://doi.org/10.1186/s12933-023-01975-5
- Burgess S, Small DS, Thompson SG. A review of instrumental variable estimators for Mendelian randomization. Stat Methods Med Res. 2017;26(5):2333-2355. https://doi.org/10.1177/0962280215597579
- Lawlor DA, Harbord RM, Sterne JAC, Timpson N, Davey Smith G. Mendelian randomization: using genes as instruments for making causal inferences in epidemiology. Stat Med. 2008;27(8):1133-1163. https://doi.org/10.1002/sim.3034
- Yang TY, Small AM, Dufresne L. Plasma proteomic biomarkers of aortic stenosis: a Mendelian randomization study. J Am Coll Cardiol. 2024;84(6):592-594. https://doi.org/10.1016/j.jacc.2024.05.046
- Nazarzadeh M, Pinho-Gomes AC, Bidel Z. Plasma lipids and risk of aortic valve stenosis: a Mendelian randomization study. Eur Heart J. 2020;41(40):3913-3920. https://doi.org/10.1093/eurheartj/ehaa070
- Zhu XG, Liu GQ, Peng YP. Exploring the mediating role of calcium homeostasis in the association between diabetes mellitus, glycemic traits, and vascular and valvular calcifications: a comprehensive Mendelian randomization analysis. Diabetol Metab Syndr. 2024;16(1):136-. https://doi.org/10.1186/s13098-024-01383-z
- Hingorani A, Humphries S. Nature’s randomised trials. Lancet. 2005;366(9501):1906-1908. https://doi.org/10.1016/S0140-6736(05)67767-7
- Skrivankova VW, Richmond RC, Woolf BA. Strengthening the reporting of observational studies in epidemiology using Mendelian randomization: the STROBE-MR statement. JAMA. 2021;326(16):1614-1621. https://doi.org/10.1001/jama.2021.18236
- Skrivankova VW, Richmond RC, Woolf BA. Strengthening the reporting of observational studies in epidemiology using Mendelian randomisation (STROBE-MR): explanation and elaboration. BMJ. 2021;375():n2233-. https://doi.org/10.1136/bmj.n2233
- Si S, Li J, Li Y. Causal effect of the triglyceride-glucose index and the joint exposure of higher glucose and triglyceride with extensive cardio-cerebrovascular metabolic outcomes in the UK Biobank: a Mendelian randomization study. Front Cardiovasc Med. 2020;7():583473-. https://doi.org/10.3389/fcvm.2020.583473
- Staiger D, Stock JH. Instrumental variables regression with weak instruments. Econometrica. 1997;65(3):557-586. https://doi.org/10.2307/2171753
- Larsson SC, Bäck M, Rees JMB, Mason AM, Burgess S. Body mass index and body composition in relation to 14 cardiovascular conditions in UK Biobank: a Mendelian randomization study. Eur Heart J. 2020;41(2):221-226. https://doi.org/10.1093/eurheartj/ehz388
- Zhu L, Li N, Shi H, Shao G, Sun L. Genetic causal association between lipidomic profiles, inflammatory proteomics, and aortic stenosis: a Mendelian randomization investigation. Eur J Med Res. 2024;29(1):446-. https://doi.org/10.1186/s40001-024-02014-z
- Shen R, Pan C, Yi G. Type 2 diabetes, circulating metabolites, and calcific aortic valve stenosis: a Mendelian randomization study. Metabolites. 2024;14(7):385-. https://doi.org/10.3390/metabo14070385
- Tastet L, Capoulade R, Clavel M-A. Systolic hypertension and progression of aortic valve calcification in patients with aortic stenosis: results from the PROGRESSA study. Eur Heart J Cardiovasc Imaging. 2017;18(1):70-78. https://doi.org/10.1093/ehjci/jew013
- Kaltoft M, Langsted A, Nordestgaard BG. Triglycerides and remnant cholesterol associated with risk of aortic valve stenosis: Mendelian randomization in the Copenhagen General Population Study. Eur Heart J. 2020;41(24):2288-2299. https://doi.org/10.1093/eurheartj/ehaa172
- Hu Z, Xiong T, Chen C. Association between the triglyceride-glucose index and calcified aortic stenosis in elderly patients: a cross-sectional study. Sci Rep. 2023;13(1):14928-. https://doi.org/10.1038/s41598-023-42206-x
- Libby P, Ridker PM, Hansson GK. Inflammation in atherosclerosis: from pathophysiology to practice. J Am Coll Cardiol. 2009;54(23):2129-2138. https://doi.org/10.1016/j.jacc.2009.09.009
- Libby P, Ridker PM, Maseri A. Inflammation and atherosclerosis. Circulation. 2002;105(9):1135-1143. https://doi.org/10.1161/hc0902.104353
- New SEP, Aikawa E. Molecular imaging insights into early inflammatory stages of arterial and aortic valve calcification. Circ Res. 2011;108(11):1381-1391. https://doi.org/10.1161/CIRCRESAHA.110.234146
- Durham AL, Speer MY, Scatena M, Giachelli CM, Shanahan CM. Role of smooth muscle cells in vascular calcification: implications in atherosclerosis and arterial stiffness. Cardiovasc Res. 2018;114(4):590-600. https://doi.org/10.1093/cvr/cvy010
- Ross R. Atherosclerosis—an inflammatory disease. N Engl J Med. 1999;340(2):115-126. https://doi.org/10.1056/NEJM199901143400207
- Moe SM, Chen NX. Mechanisms of vascular calcification in chronic kidney disease. J Am Soc Nephrol. 2008;19(2):213-216. https://doi.org/10.1681/ASN.2007080854
- Bennett BJ, Wang SS, Wang X, Wu X, Lusis AJ. Genetic regulation of atherosclerotic plaque size and morphology in the innominate artery of hyperlipidemic mice. Arterioscler Thromb Vasc Biol. 2009;29(3):348-355. https://doi.org/10.1161/ATVBAHA.108.176685
- Yu Chen H, Dina C, Small AM. Dyslipidemia, inflammation, calcification, and adiposity in aortic stenosis: a genome-wide study. Eur Heart J. 2023;44(21):1927-1939. https://doi.org/10.1093/eurheartj/ehad142